


A newer version of
Freeform
is available.
Try Freeform 5 now →
Form Types
Surveys & Polls Form Type Add-on
Expand the possibilities of Freeform with the Surveys & Polls form type! This is a plug and play add-on to Freeform that instantly adds far more functionality to your forms. With the Surveys & Polls form type, you get access to a special reporting area inside the control panel that allows you to view stats and charts for each field type. The reports can be customized to use different chart types and hide specific fields. You can even generate a PDF exported document to share with other members of your team.
TIP
If you already have some forms used as surveys or polls, simply switch the form type to Surveys & Polls and you'll instantly and retroactively have reports available for these forms!
Key Features
The following features are unique to the Surveys & Polls form type:
- Review and customize survey or poll results with rich chart options for each form in the control panel.
- Show users on the front end the results for the survey or poll for each form.
- Export survey results as a PDF file to share with other team members.
- Plug and play with existing forms used as surveys to retroactively unlock rich reporting instantly.
The following features are available for any form inside the core Freeform plugin, but become powerful when combined with the Surveys & Polls form type:
- Intuitive form builder that allows site admins to easily create and customize surveys and polls.
- Powerful field types to handle every kind of question and flow.
- Break up your surveys into multiple pages so users don't get overwhelmed.
- Conditionally show and hide questions or skip pages entirely, based on the selection of other fields.
- Limit how many times a user can submit the survey or poll, or if they need to be logged in, etc.
- Set a close date for surveys and polls.
- Allow users to save & continue completing the survey later.
- A wide variety of built-in spam protection measures.
- Send email notifications to form submitters and/or site admins upon completion.
- Connect forms to CRM's and Email Marketing integrations.
Requirements
Freeform Surveys & Polls has the following requirements:
Eligible Field Types
While you can certainly use any field type in your survey and poll forms, Freeform will only recognize certain field types to apply special handling for charts and other stats.
| Field Type | CP Reports | Charts | Average Score* |
|---|---|---|---|
| Checkbox group | ✓ | ✓ | ✓ |
| Radio group | ✓ | ✓ | ✓ |
| Select | ✓ | ✓ | ✓ |
| Multiple select | ✓ | ✓ | ✓ |
| Opinion scale | ✓ | ✓ | ✓ |
| Rating | ✓ | ✓ | ✓ |
| Text (includes Email, Number, Phone, Regex, Website) | ✓ | ||
| Textarea | ✓ |
*Average score available when the field contains only numeric option values, e.g. 1, 2, 3.
There is currently no support for displaying the following field types in reports: Date & Time, Dynamic Recipients, File Upload, File Upload Drag & Drop, Hidden, Invisible, Signature, and Table.
Dashboard & Reports
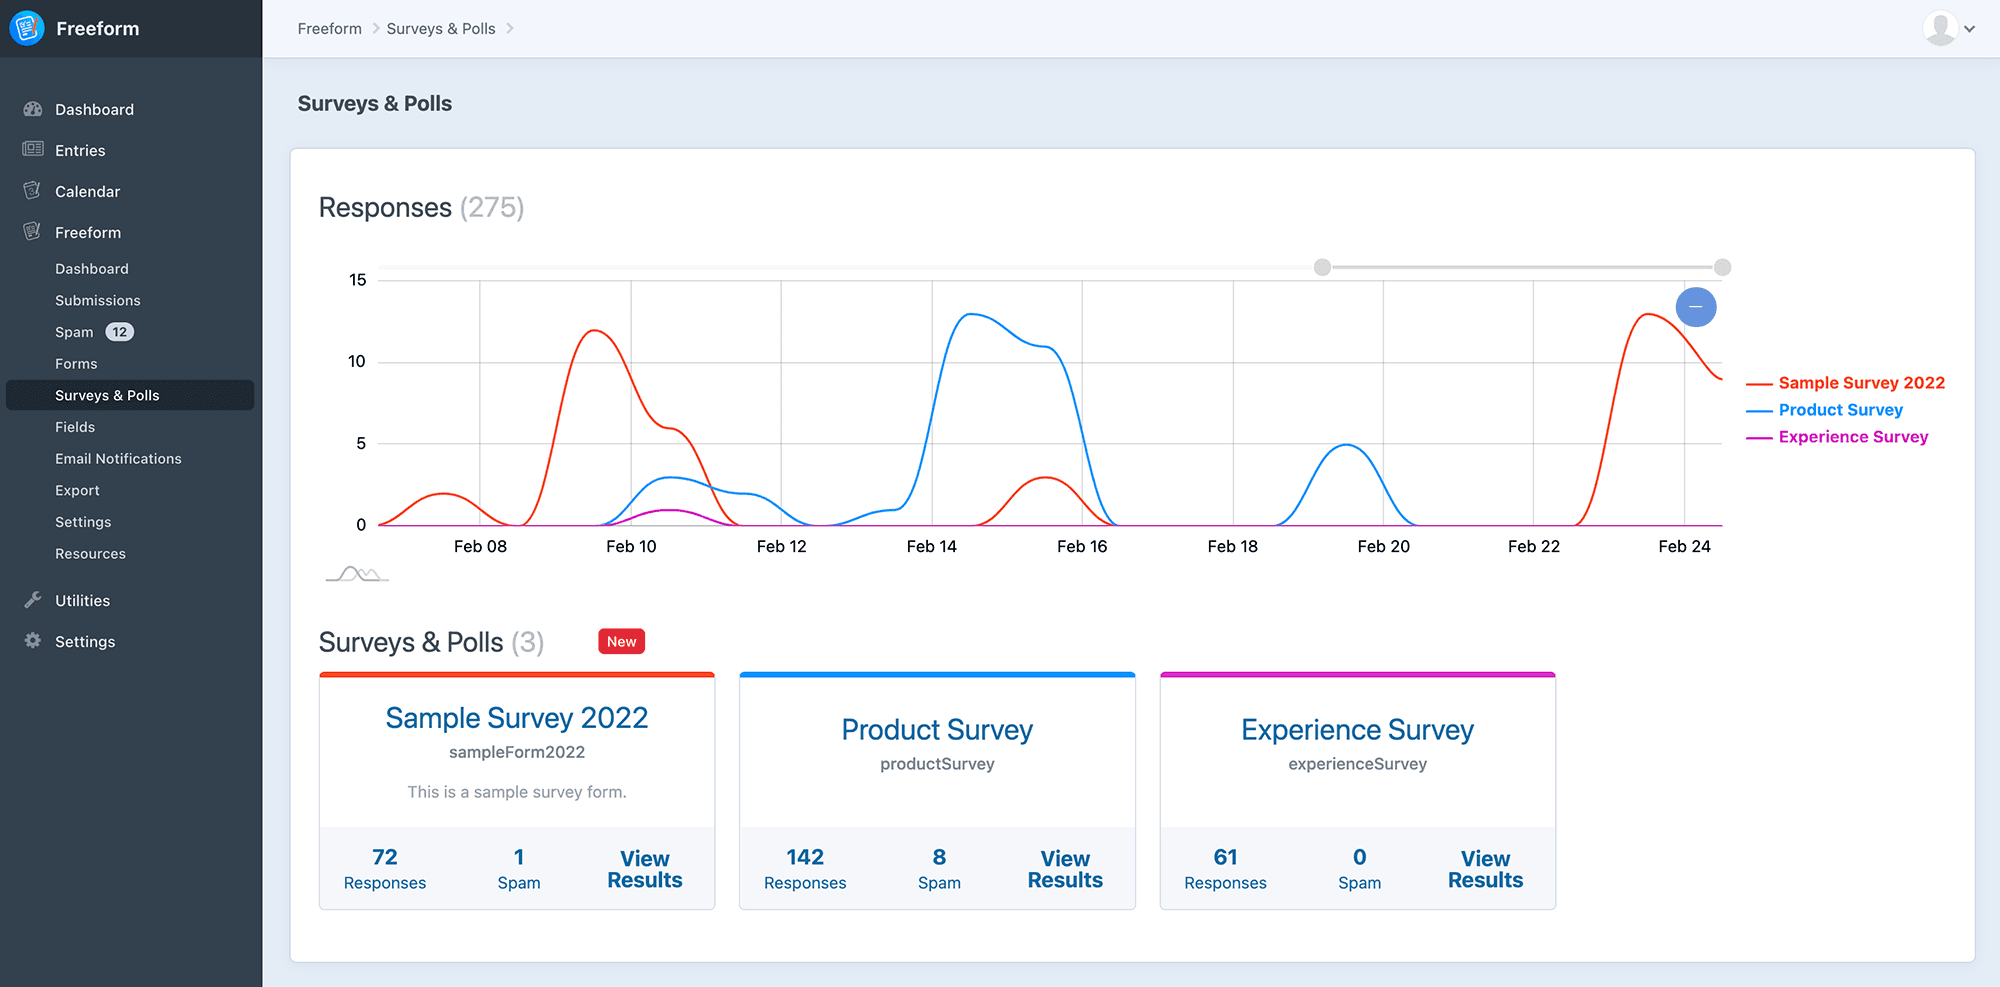
The Surveys & Polls area includes a dashboard that is similar to the regular Freeform dashboard, but will only display all forms that belong to the Surveys & Polls form type. This will provide an overview of all available surveys and polls, and you can click on each one to view the results.
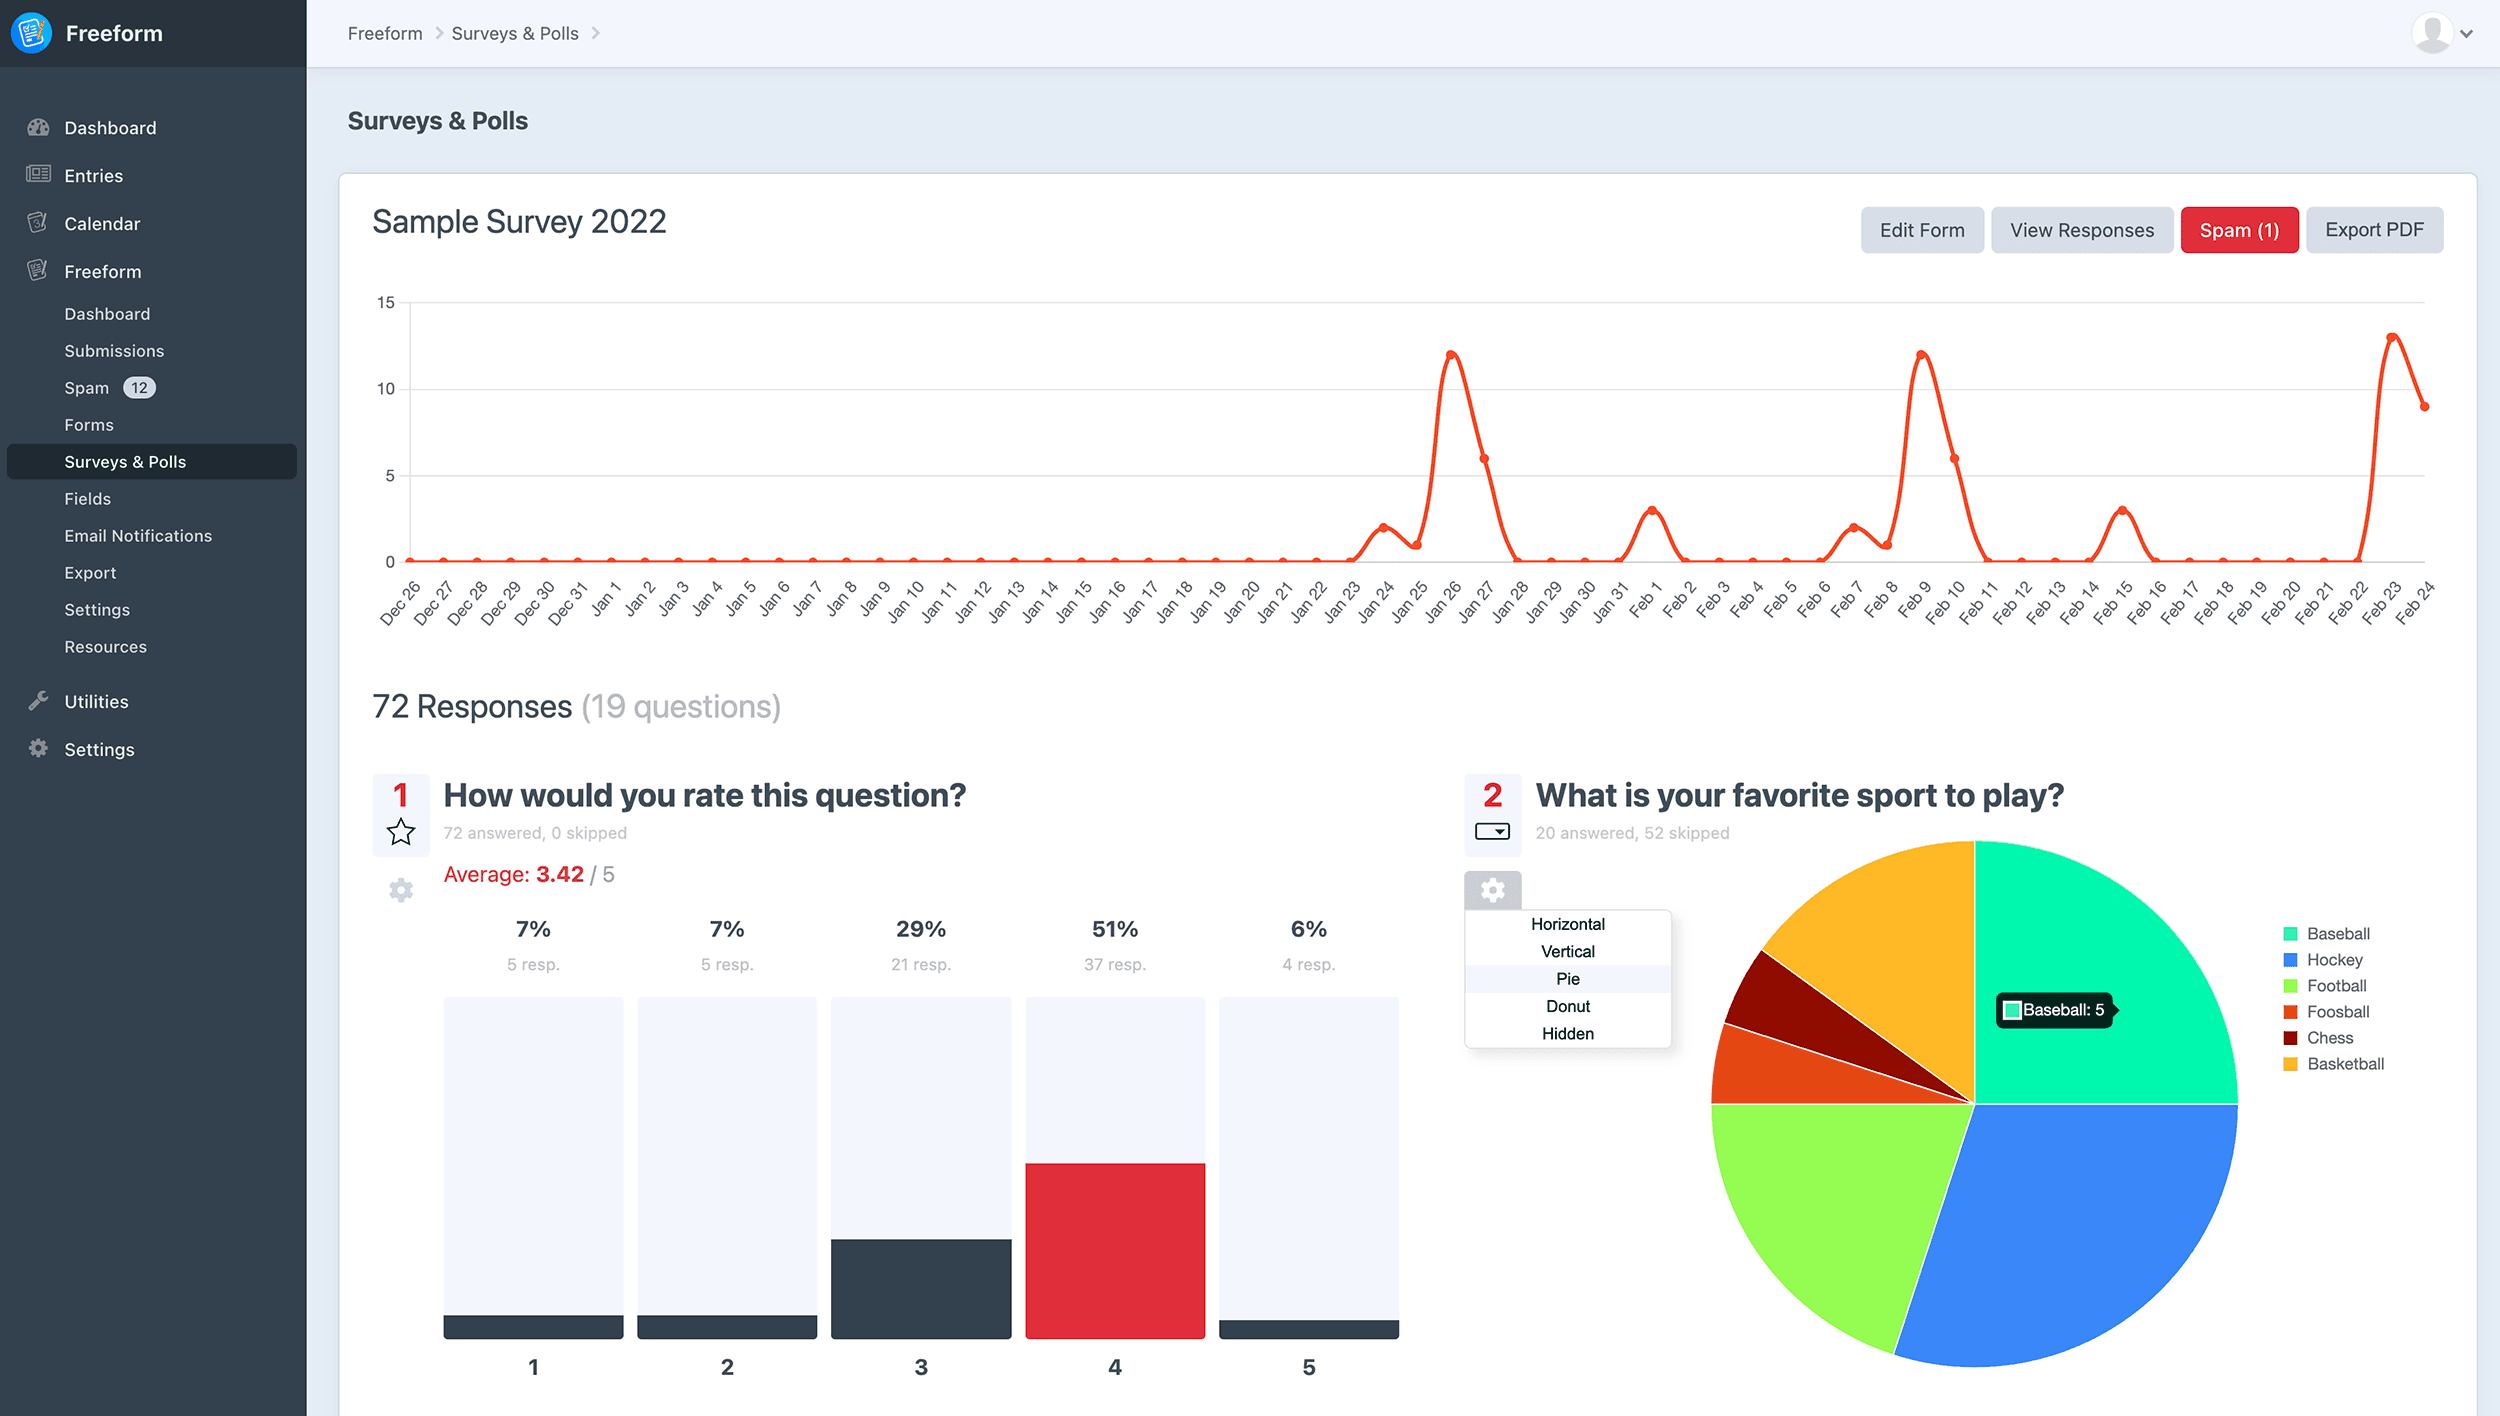
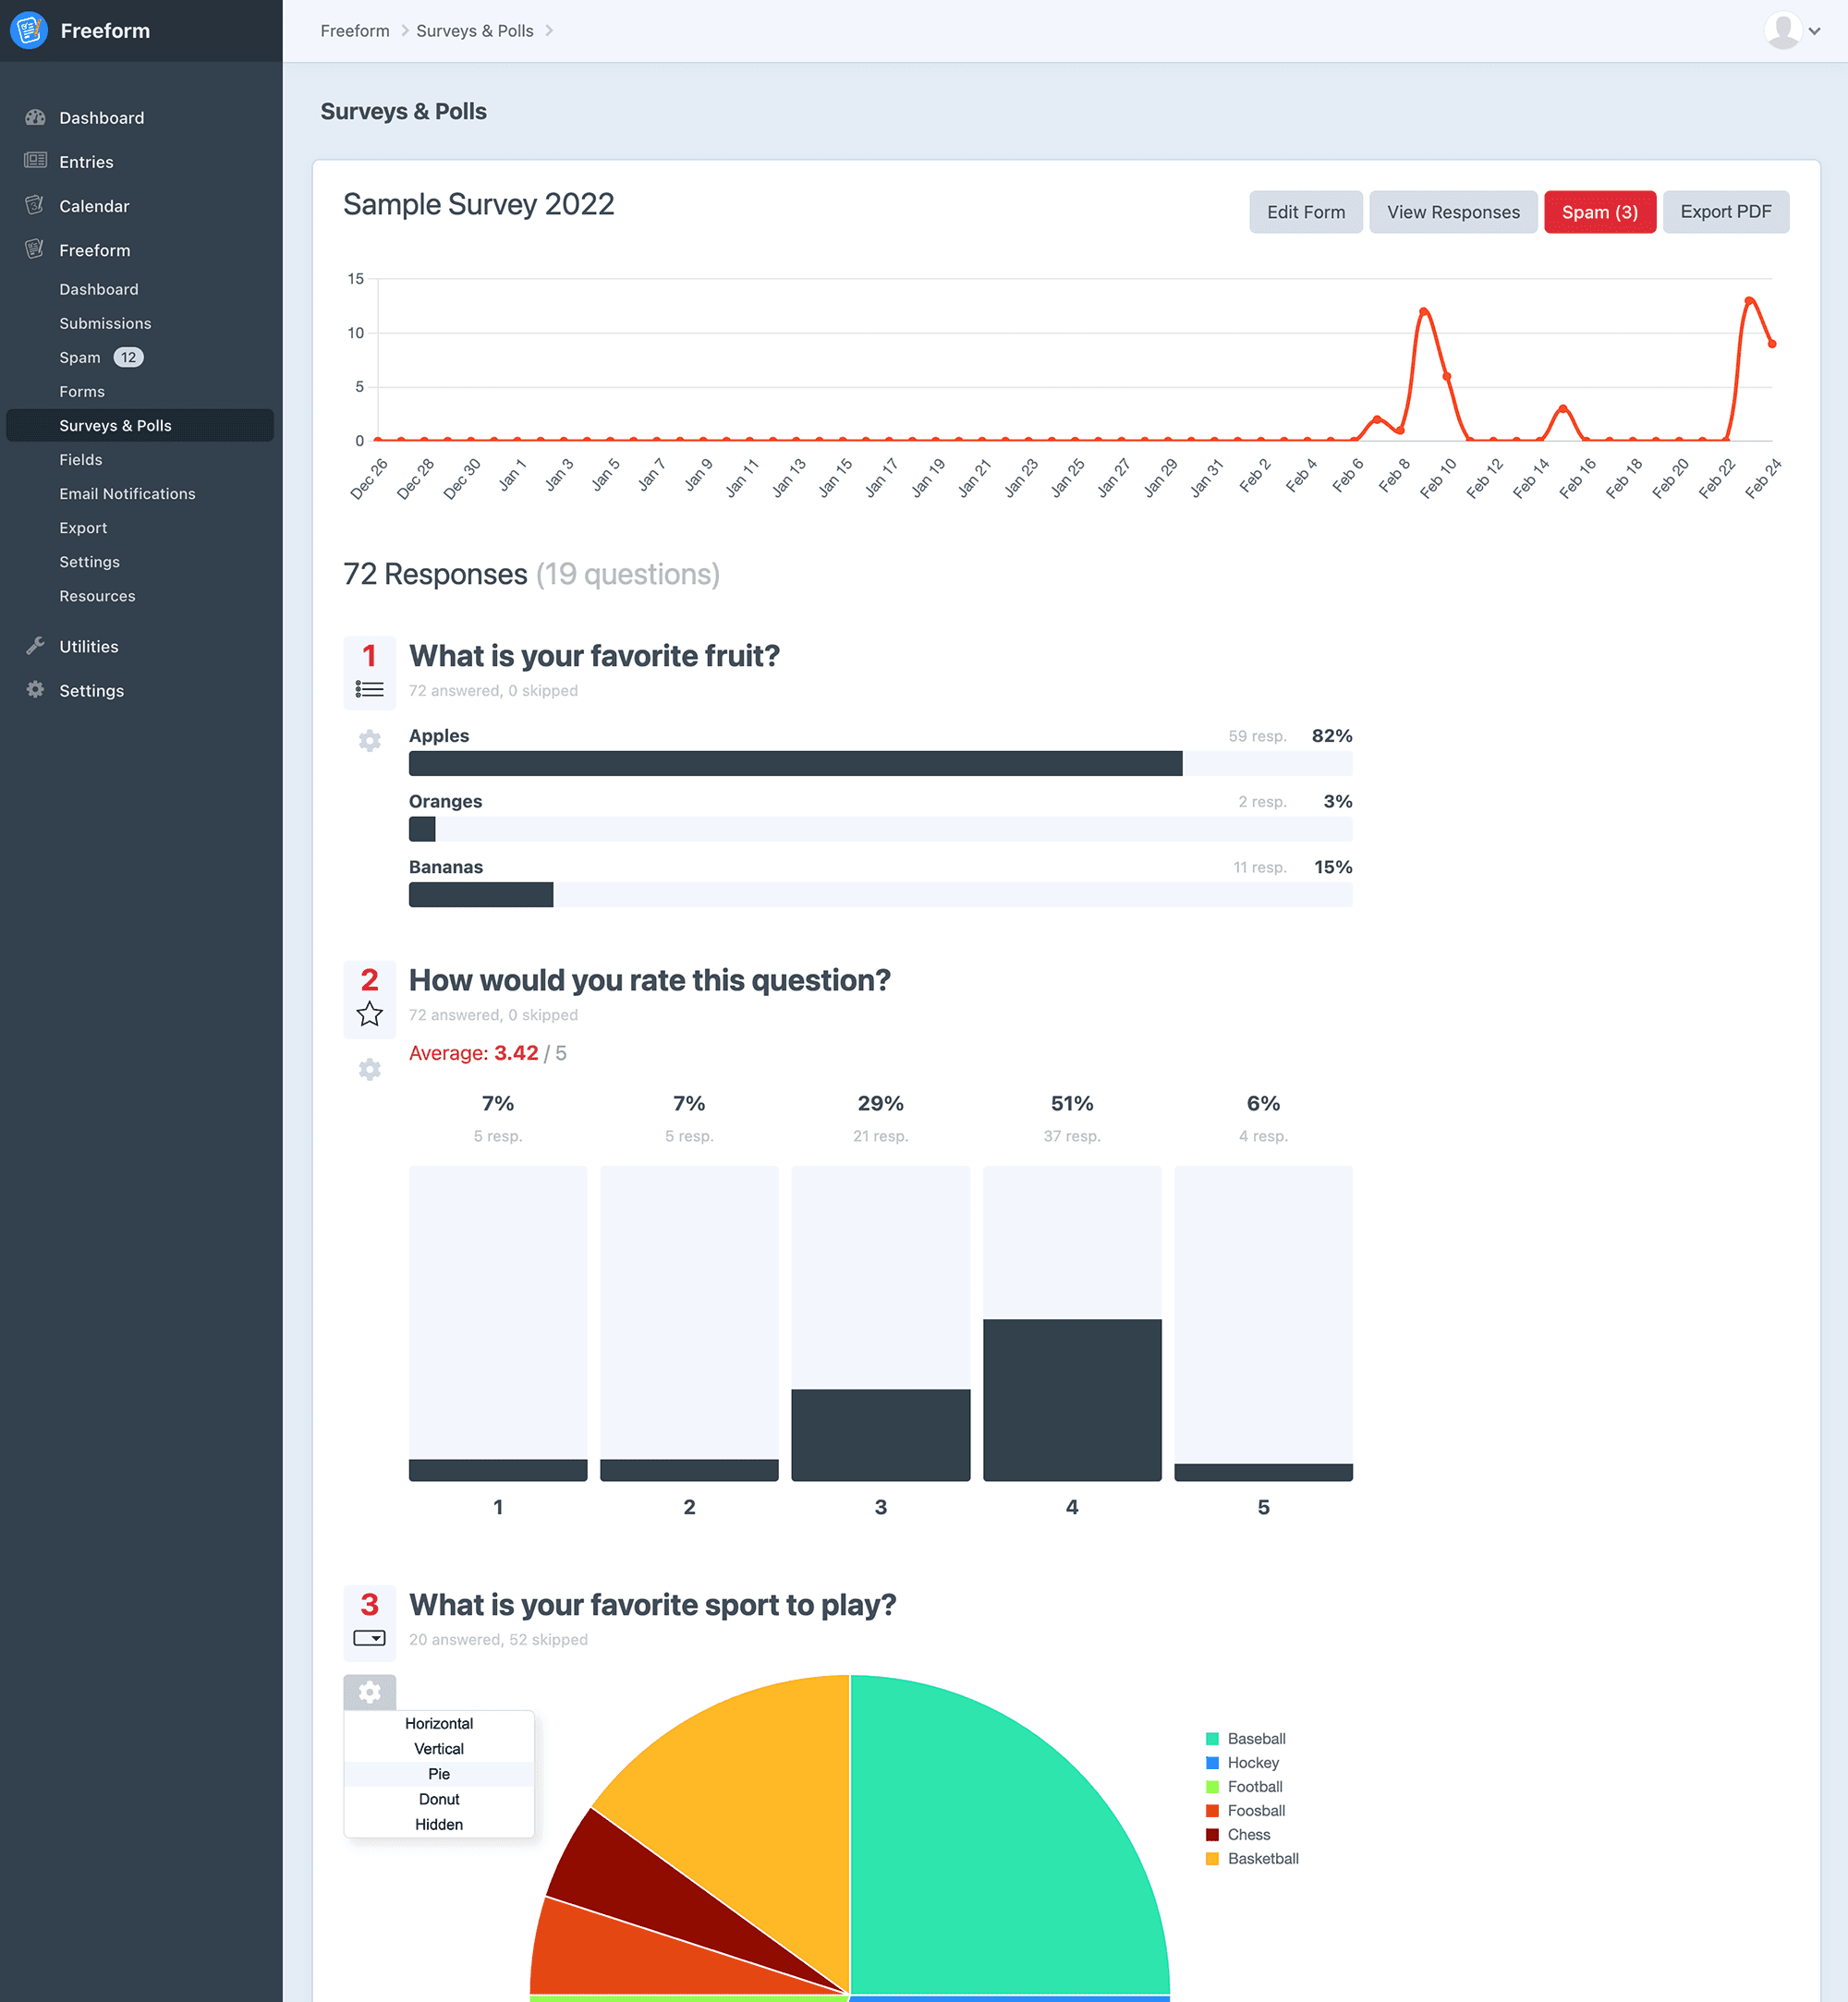
An individual report page is available for each Survey & Poll form, which will show the results of the survey or poll as a report summary. Applicable field types will appear as charts and graphs, and you'll have the option to change the chart type for each question/field to whatever suits it better (changes are saved and apply to all users). And finally, an option to generate a PDF export is available if you wish to share the results with other team members.
Charts can be used with Checkbox group, Radio group, Select, Multiple select, Opinion scale, and Rating field types. Available chart types are:
- Horizontal Bar
- Vertical Bar
- Pie
- Donut
- Hidden (entire question and results are hidden in report)
Text option display is available for simpler text-based field types, including Text, Textarea, Email, Number, Phone, Regex, and Website.
- Text
- Hidden (entire question and results are hidden in report)
Creating a Survey
With the magnitude of features and options Freeform offers, there isn't any one way to create a survey or poll form. So many approaches are available to you:
- Will this be a single page form or will you break up your surveys into multiple pages so users don't get overwhelmed?
- Which field types will you use? A wide variety of options are available to suit every kind of question and flow.
- Will you conditionally show and hide some questions or skip pages entirely, based on the selection of other fields?
- Does the survey have a close date?
Create a New Survey
To create a new survey, the process is almost identical to creating a regular form, but be aware of a few things that are necessary for Freeform to properly handle and recognize your survey forms:
- Be sure to have both Freeform and Freeform Surveys & Polls plugins installed on your site.
- Inside the form builder (or form wizard), be sure to set the Type setting to Surveys & Polls from the available options.
- For questions you want to show up as charts in reports, stick to using the Checkbox group, Radio group, Select, Multiple select, Opinion scale, and Rating field types.
- For questions you want to show up as text in reports, be sure to use only Text, Textarea, Email, Number, Phone, Regex, and Website fields. All other field types such as File Upload, Signatures, etc will not appear in the Surveys & Polls reports area.
- If you want restrict people from submitting the survey more than once, be sure to select an option in the Limit Form Submission Rate setting, which is located in the Validation tab.
- If you want to stop people from submitting the survey after a certain date, be sure to specify a date in the Stop Submissions After setting, which is located in the Validation tab.
Convert an Existing Form
To convert an existing form to be a Surveys & Polls form, simply follow the instructions below:
- Go to the Forms page in the Freeform control panel.
- Click on the form to edit it inside the form builder.
- Inside the Form Settings tab, change the Form Type setting from Regular to Surveys & Polls.
- Save the form.
Usage in Templates
The surveyResults method becomes available for use in your templates though the Form query query:
- Iterate over all results (
{% for result in form.surveyResults %}):votes- get the total number answers for this field.skipped- get the total number of skipped answers for this field.average- get the average numeric value across all answers for this field.- This will return
nullif any of the answers aren't numeric.
- This will return
max- get the highest numeric value this field may contain.- Useful when displaying the average answer chosen to be able to show the max value (e.g.
4.3 / 5)
- Useful when displaying the average answer chosen to be able to show the max value (e.g.
- Access
fieldobject:field.idfield.label- etc
breakdown- access breakdown of answers ({% for answer in result.breakdown %}):- Limiting and ordering results (typically used for text fields):
breakdown- will show all responses in order they were addedbreakdown(3)- fetch only the 3 highest ranked answersbreakdown(-3)- fetch only the 3 lowest ranked answersbreakdown(true)- order all answers by highest rankbreakdown(false)- order all answers by lowest rank
- Properties:
label- label of the given answer (will use the answer value for text fields).value- value of the given answer.votes- number of times this answer was selected.percentage- calculated percentage of times this answer was selected against all other options.ranking- number of the rank for this answer, with1being the top answer.
- Limiting and ordering results (typically used for text fields):
Examples
The following are several examples of how to iterate over fields' submission data and display survey results for each.
- Extract Specific Field Results
- Example with Bootstrap Library
- Example with Chart.js Library
- Iterate Over All Field Types
Extract Specific Field Results
The following example will generate survey or poll results for a specific field.
{% set form = craft.freeform.form("myFormHandle") %}

{% set field = form.get('myFieldHande') %}
{% set result = form.surveyResults(field) %}

{% for answer in result.breakdown %}
    <h6 class="mt-4">{{ answer.label }} <small>({{ answer.votes }} votes)</small></h6>
    <div class="progress" style="height: 30px;">
        <div class="progress-bar" role="progressbar" style="width: {{ answer.percentage|round(1) }}%" aria-valuenow="{{ answer.percentage|round(1) }}" aria-valuemin="0" aria-valuemax="100">{% if answer.percentage > '0' %}{{ answer.percentage|round(0) }}%{% endif %}</div>
    </div>
{% endfor %}
2
3
4
5
6
7
8
9
10
11
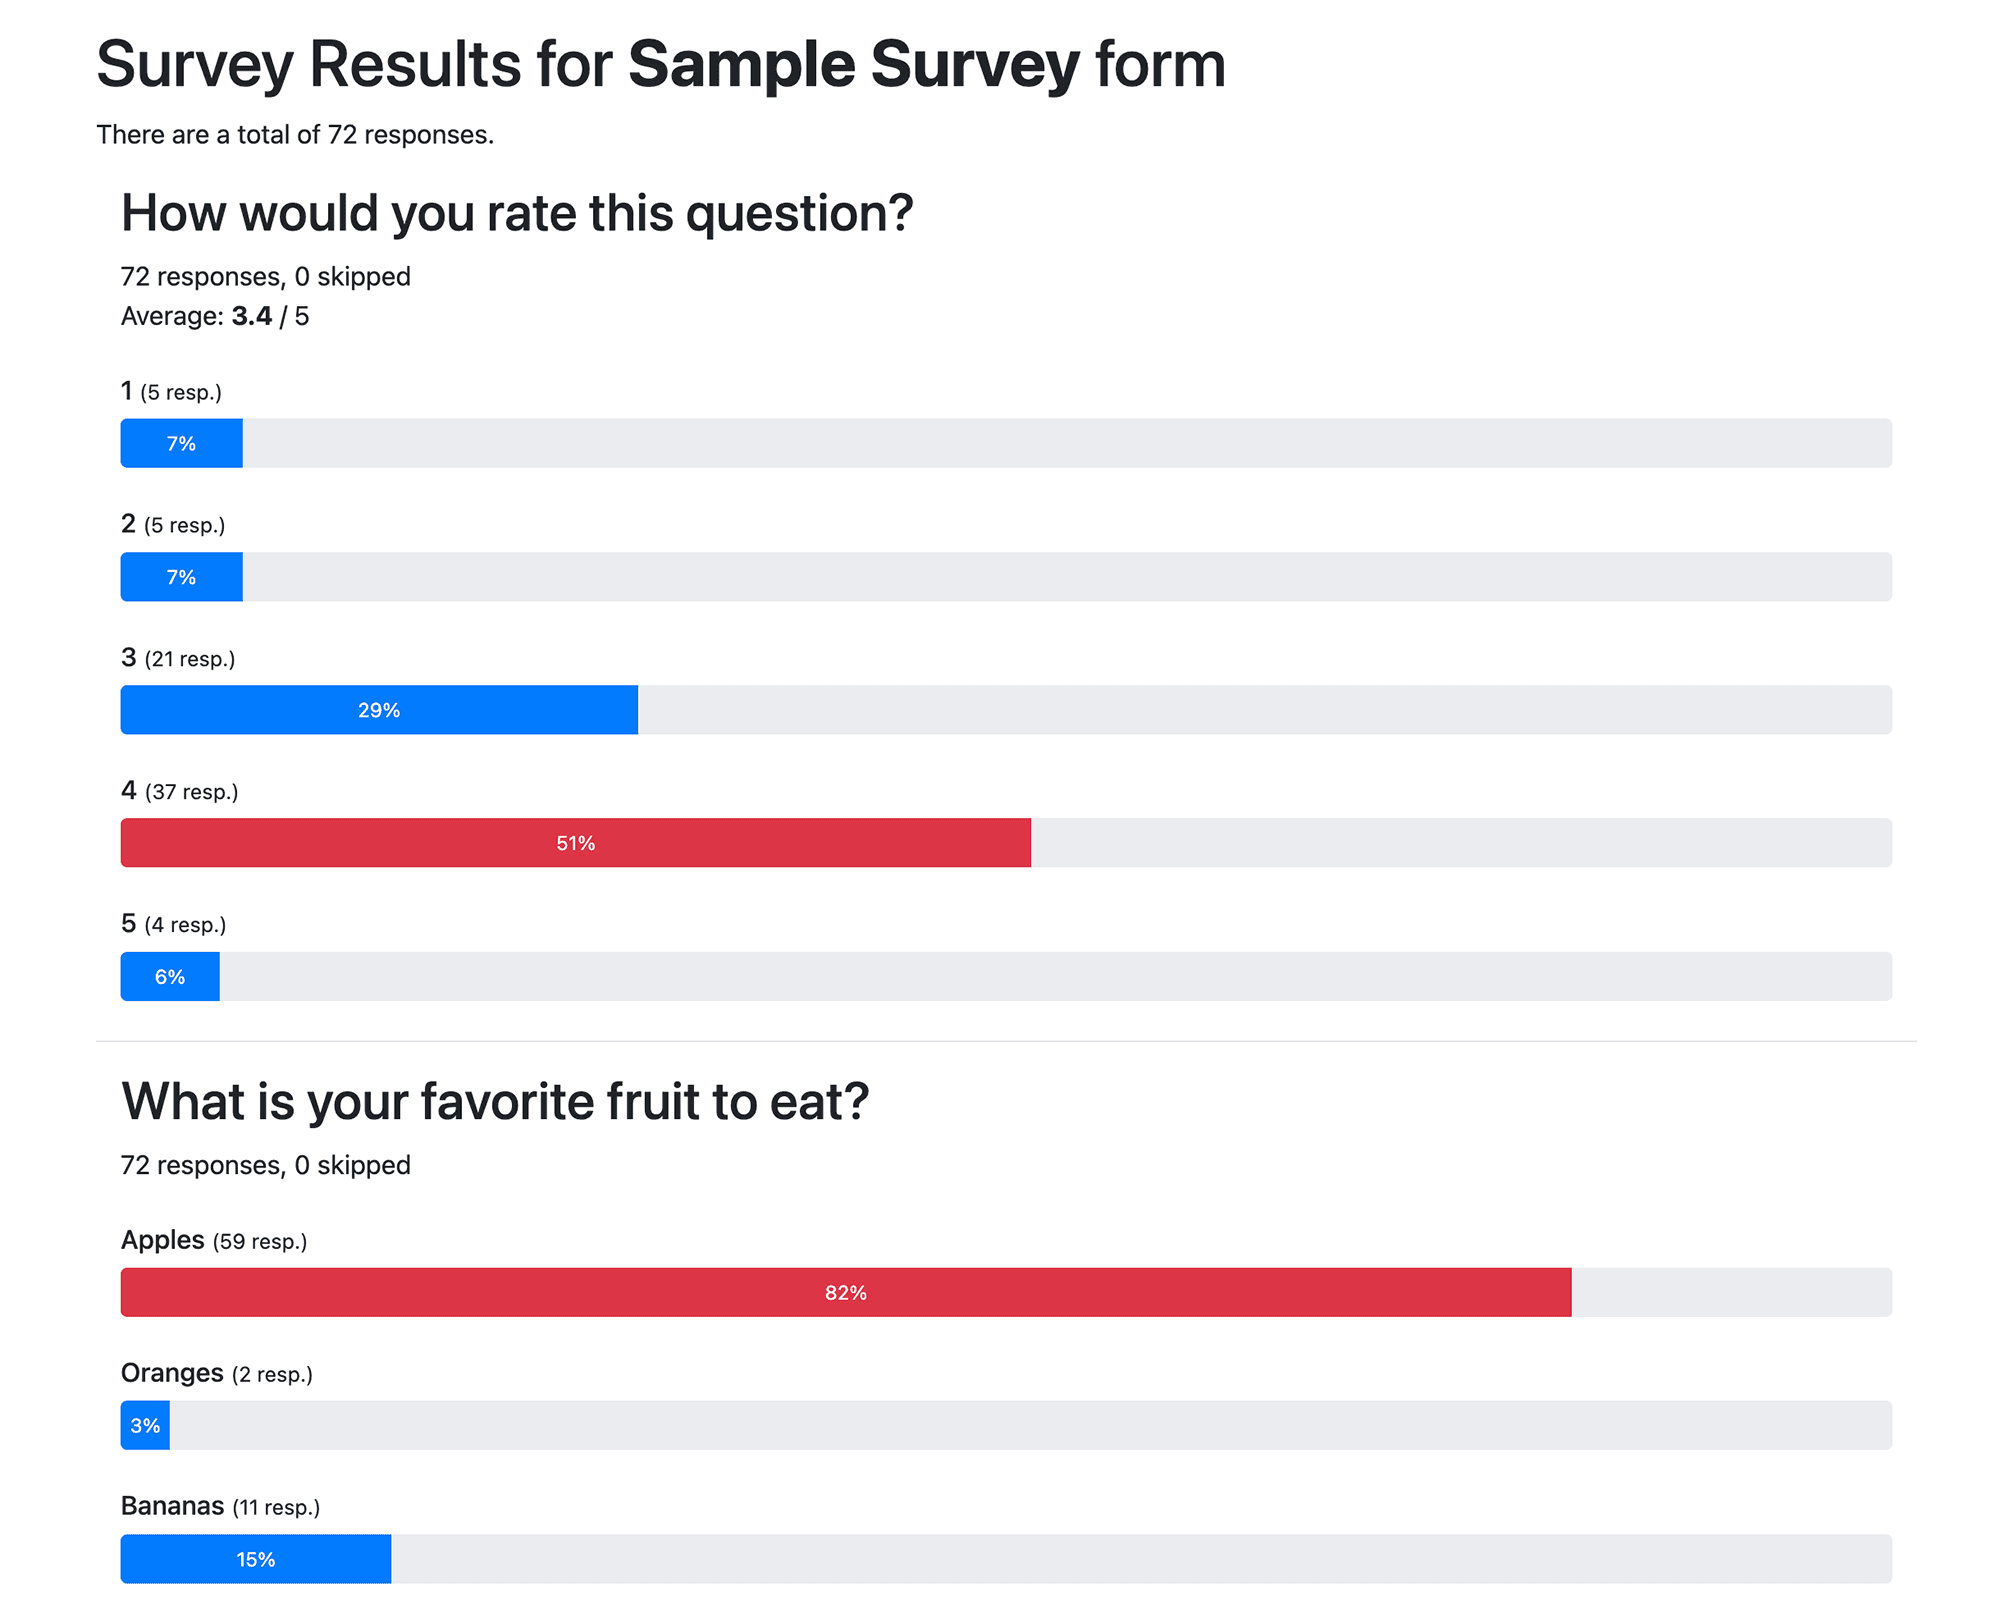
Example with Bootstrap Library
The below example uses the Bootstrap library to generate charts with your survey or poll questions and responses for all eligible survey/poll field types.
<style>
    .chart-textarea-responses {
        max-height: 300px;
        overflow-y: scroll;
    }
</style>

{% set form = craft.freeform.form("myFormHandle") %}
{% set results = form.surveyResults %}

<h1>Survey Results for <b>{{ form.name }}</b> form</h1>
<p>There are a total of {{ craft.freeform.submissions({form}).count }} responses.</p>

{% for result in results %}
<div class="container">
    {% set field = result.field %}
    <h2>{{ field.label }}</h2>
    <p>
        {{ result.votes }} responses, {{ result.skipped }} skipped
        {% if result.average|length %}
            <br />Average: <b>{{ result.average|round(1) }}</b> / {{ result.max }}
        {% endif %}
    </p>
    {% if field.type not in ["text", "textarea", "email", "phone", "website", "number", "regex"] %}
        {% for answer in result.breakdown %}
            <h6 class="mt-4">{{ answer.label }} <small>({{ answer.votes }} resp.)</small></h6>
            <div class="progress" style="height: 30px;">
                <div class="progress-bar{{ answer.ranking == 1 ? ' bg-danger' }}" role="progressbar" style="width: {{ answer.percentage|round(1) }}%" aria-valuenow="{{ answer.percentage|round(1) }}" aria-valuemin="0" aria-valuemax="100">{% if answer.percentage > '0' %}{{ answer.percentage|round(0) }}%{% endif %}</div>
            </div>
        {% endfor %}
    {% elseif field.type in ["text", "email", "phone", "website", "number", "regex"] %}
        <p>Top 10 text responses:</p>
        <ul>
        {% for answer in result.breakdown(10) %}
            <li>{{ answer.value }} ({{ answer.votes }})</li>
        {% endfor %}
        </ul>
    {% elseif field.type == "textarea" %}
        <p>Long answer responses (scroll to see all):</p>
        <ul class="chart-textarea-responses">
        {% for answer in result.breakdown %}
            <li>{{ answer.value }}</li>
        {% endfor %}
        </ul>
    {% endif %}
</div>
<hr class="mt-4" />
{% endfor %}
2
3
4
5
6
7
8
9
10
11
12
13
14
15
16
17
18
19
20
21
22
23
24
25
26
27
28
29
30
31
32
33
34
35
36
37
38
39
40
41
42
43
44
45
46
47
48
Example with Chart.js Library
The below example uses the Chart.js library to generate charts with your survey or poll questions and responses for all eligible survey/poll field types.
<style>
    .chart-textarea-responses {
        max-height: 300px;
        overflow-y: scroll;
    }
</style>
<script src="https://cdn.jsdelivr.net/npm/chart.js"></script>

{% set form = craft.freeform.form("myFormHandle") %}
{% set results = form.surveyResults %}

<h1>Survey Results for <b>{{ form.name }}</b> form</h1>
<p>There are a total of {{ craft.freeform.submissions({form}).count }} responses.</p>

{% for result in results %}
<div class="container">
    {% set field = result.field %}
    <h2>{{ field.label }}</h2>
    <p>
        {{ result.votes }} responses, {{ result.skipped }} skipped
        {% if result.average|length %}
            <br />Average: <b>{{ result.average|round(1) }}</b> / {{ result.max }}
        {% endif %}
    </p>
    {% if field.type not in ["text", "textarea", "email", "phone", "website", "number", "regex"] %}
        <canvas id="chart{{ field.handle }}" width="800" height="300"></canvas>
        <script>
            const chart{{ field.handle }}labels = [
            {% for answer in result.breakdown %}
                '{{ answer.label }}',
            {% endfor %}
            ];
            const chart{{ field.handle }}data = {
                labels: chart{{ field.handle }}labels,
                datasets: [{
                label: '{{ field.label }}',
                backgroundColor: 'rgb(255, 99, 132)',
                borderColor: 'rgb(255, 99, 132)',
                data: [
                {% for answer in result.breakdown %}
                    {{ answer.votes }},
                {% endfor %}
                ],
                }]
            };
            const chart{{ field.handle }}config = {
                type: 'bar',
                data: chart{{ field.handle }}data,
                options: {
                    indexAxis: 'x',
                    responsive: false,
                    barThickness: 50,
                    plugins: {
                        legend: {
                            display: false,
                        }
                    },
                    scales: {
                        x: {
                            grid: {
                                display: false,
                            }
                        }
                    },
                }
            };
        </script>
        <script>
            const chart{{ field.handle }} = new Chart(
                document.getElementById('chart{{ field.handle }}'),
                chart{{ field.handle }}config
            );
        </script>
    {% elseif field.type in ["text", "email", "phone", "website", "number", "regex"] %}
        <p>Top 10 text responses:</p>
        <ul>
        {% for answer in result.breakdown(10) %}
            <li>{{ answer.value }} ({{ answer.votes }})</li>
        {% endfor %}
        </ul>
    {% elseif field.type == "textarea" %}
        <p>Long answer responses (scroll to see all):</p>
        <ul class="chart-textarea-responses">
        {% for answer in result.breakdown %}
            <li>{{ answer.value }}</li>
        {% endfor %}
        </ul>
    {% endif %}
</div>
<hr />
{% endfor %}
2
3
4
5
6
7
8
9
10
11
12
13
14
15
16
17
18
19
20
21
22
23
24
25
26
27
28
29
30
31
32
33
34
35
36
37
38
39
40
41
42
43
44
45
46
47
48
49
50
51
52
53
54
55
56
57
58
59
60
61
62
63
64
65
66
67
68
69
70
71
72
73
74
75
76
77
78
79
80
81
82
83
84
85
86
87
88
89
90
91
Iterate Over All Field Types
The following example will iterate over all fields, compatible with Survey & Polls special behavior or not.
{% set form = craft.freeform.form("myFormHandle") %}

{% for row in form %}
    <div>
        {% for field in row %}
            {% set results = form.surveyResults(field) %}
            <div>
                <label>{{ field.label }}</label>
                {% if results %}
                    <ul>
                        {% for answer in results %}
                            <li>{{ answer.label }} ({{ answer.votes }})</li>
                        {% endfor %}
                    </ul>
                {% else %}
                    <div>
                        No survey results for this field.
                    </div>
                {% endif %}
            </div>
        {% endfor %}
    </div>
{% endfor %}
2
3
4
5
6
7
8
9
10
11
12
13
14
15
16
17
18
19
20
21
22
23
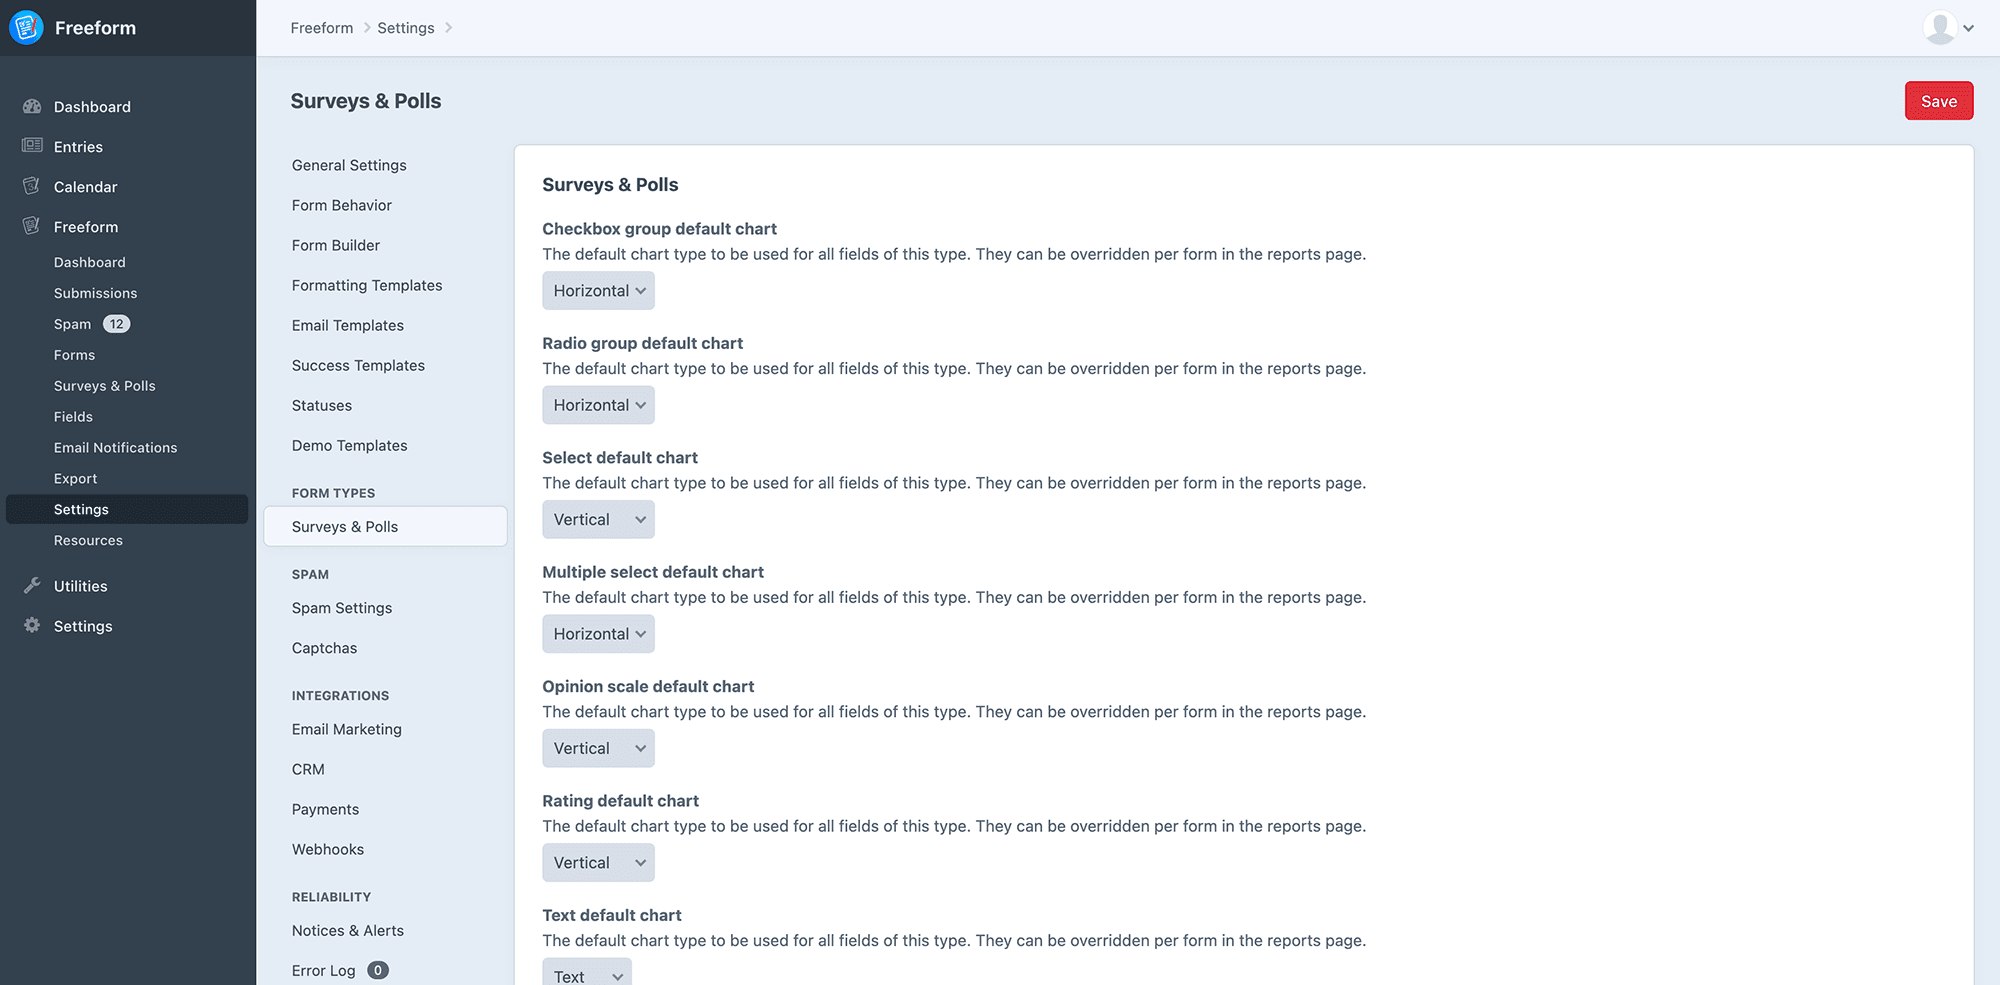
Settings
The Surveys & Polls form type offers a handful of settings that help you set defaults and styling for reports. While the settings for Surveys & Polls are available in the main Freeform settings area, they are stored separately in a freeform-surveys-polls section of the Craft project config project.yaml file.
TIP
This page and its settings all become inaccessible when the Craft allowAdminChanges config setting is set to false.
| Setting | Description |
|---|---|
| Checkbox group default chart | The default chart type to be used for all fields of this type. They can be overridden per form in the reports page. |
| Radio group default chart | The default chart type to be used for all fields of this type. They can be overridden per form in the reports page. |
| Select default chart | The default chart type to be used for all fields of this type. They can be overridden per form in the reports page. |
| Multiple select default chart | The default chart type to be used for all fields of this type. They can be overridden per form in the reports page. |
| Opinion scale default chart | The default chart type to be used for all fields of this type. They can be overridden per form in the reports page. |
| Rating default chart | The default chart type to be used for all fields of this type. They can be overridden per form in the reports page. |
| Text default chart | The default chart type to be used for all fields of this type. They can be overridden per form in the reports page. |
| Textarea default chart | The default chart type to be used for all fields of this type. They can be overridden per form in the reports page. |
| Email default chart | The default chart type to be used for all fields of this type. They can be overridden per form in the reports page. |
| Number default chart | The default chart type to be used for all fields of this type. They can be overridden per form in the reports page. |
| Phone default chart | The default chart type to be used for all fields of this type. They can be overridden per form in the reports page. |
| Regex default chart | The default chart type to be used for all fields of this type. They can be overridden per form in the reports page. |
| Website default chart | The default chart type to be used for all fields of this type. They can be overridden per form in the reports page. |
| Highlight highest ranking option? | When enabled, Freeform will highlight the highest ranking option chosen for each question with an alternate color. |
TIP
For page usibility, the Surveys & Polls report page will automatically switch the default chart type from vertical bar to horizontal bar if the field contains more than 10 values. You can change it back to vertical bar inside the report page if you wish.
Permissions
The following user / group permissions become available with the Surveys & Polls form type:
- Access Surveys & Polls
- Allow access to the Surveys & Polls dashboard and reports pages.
- Users will still need valid form permissions to administrate forms and valid submission permissions to view individual survey responses.
- Manage Reports
- Allow changes to the chart style for each question in Surveys & Polls reports.